
Managing agent relationships is a critical element of the job for acquisition managers. However, it can be challenging to analyse the effectiveness of agent relationships. What if there was a tool to help you understand which agents provided you with the highest quality of intros?
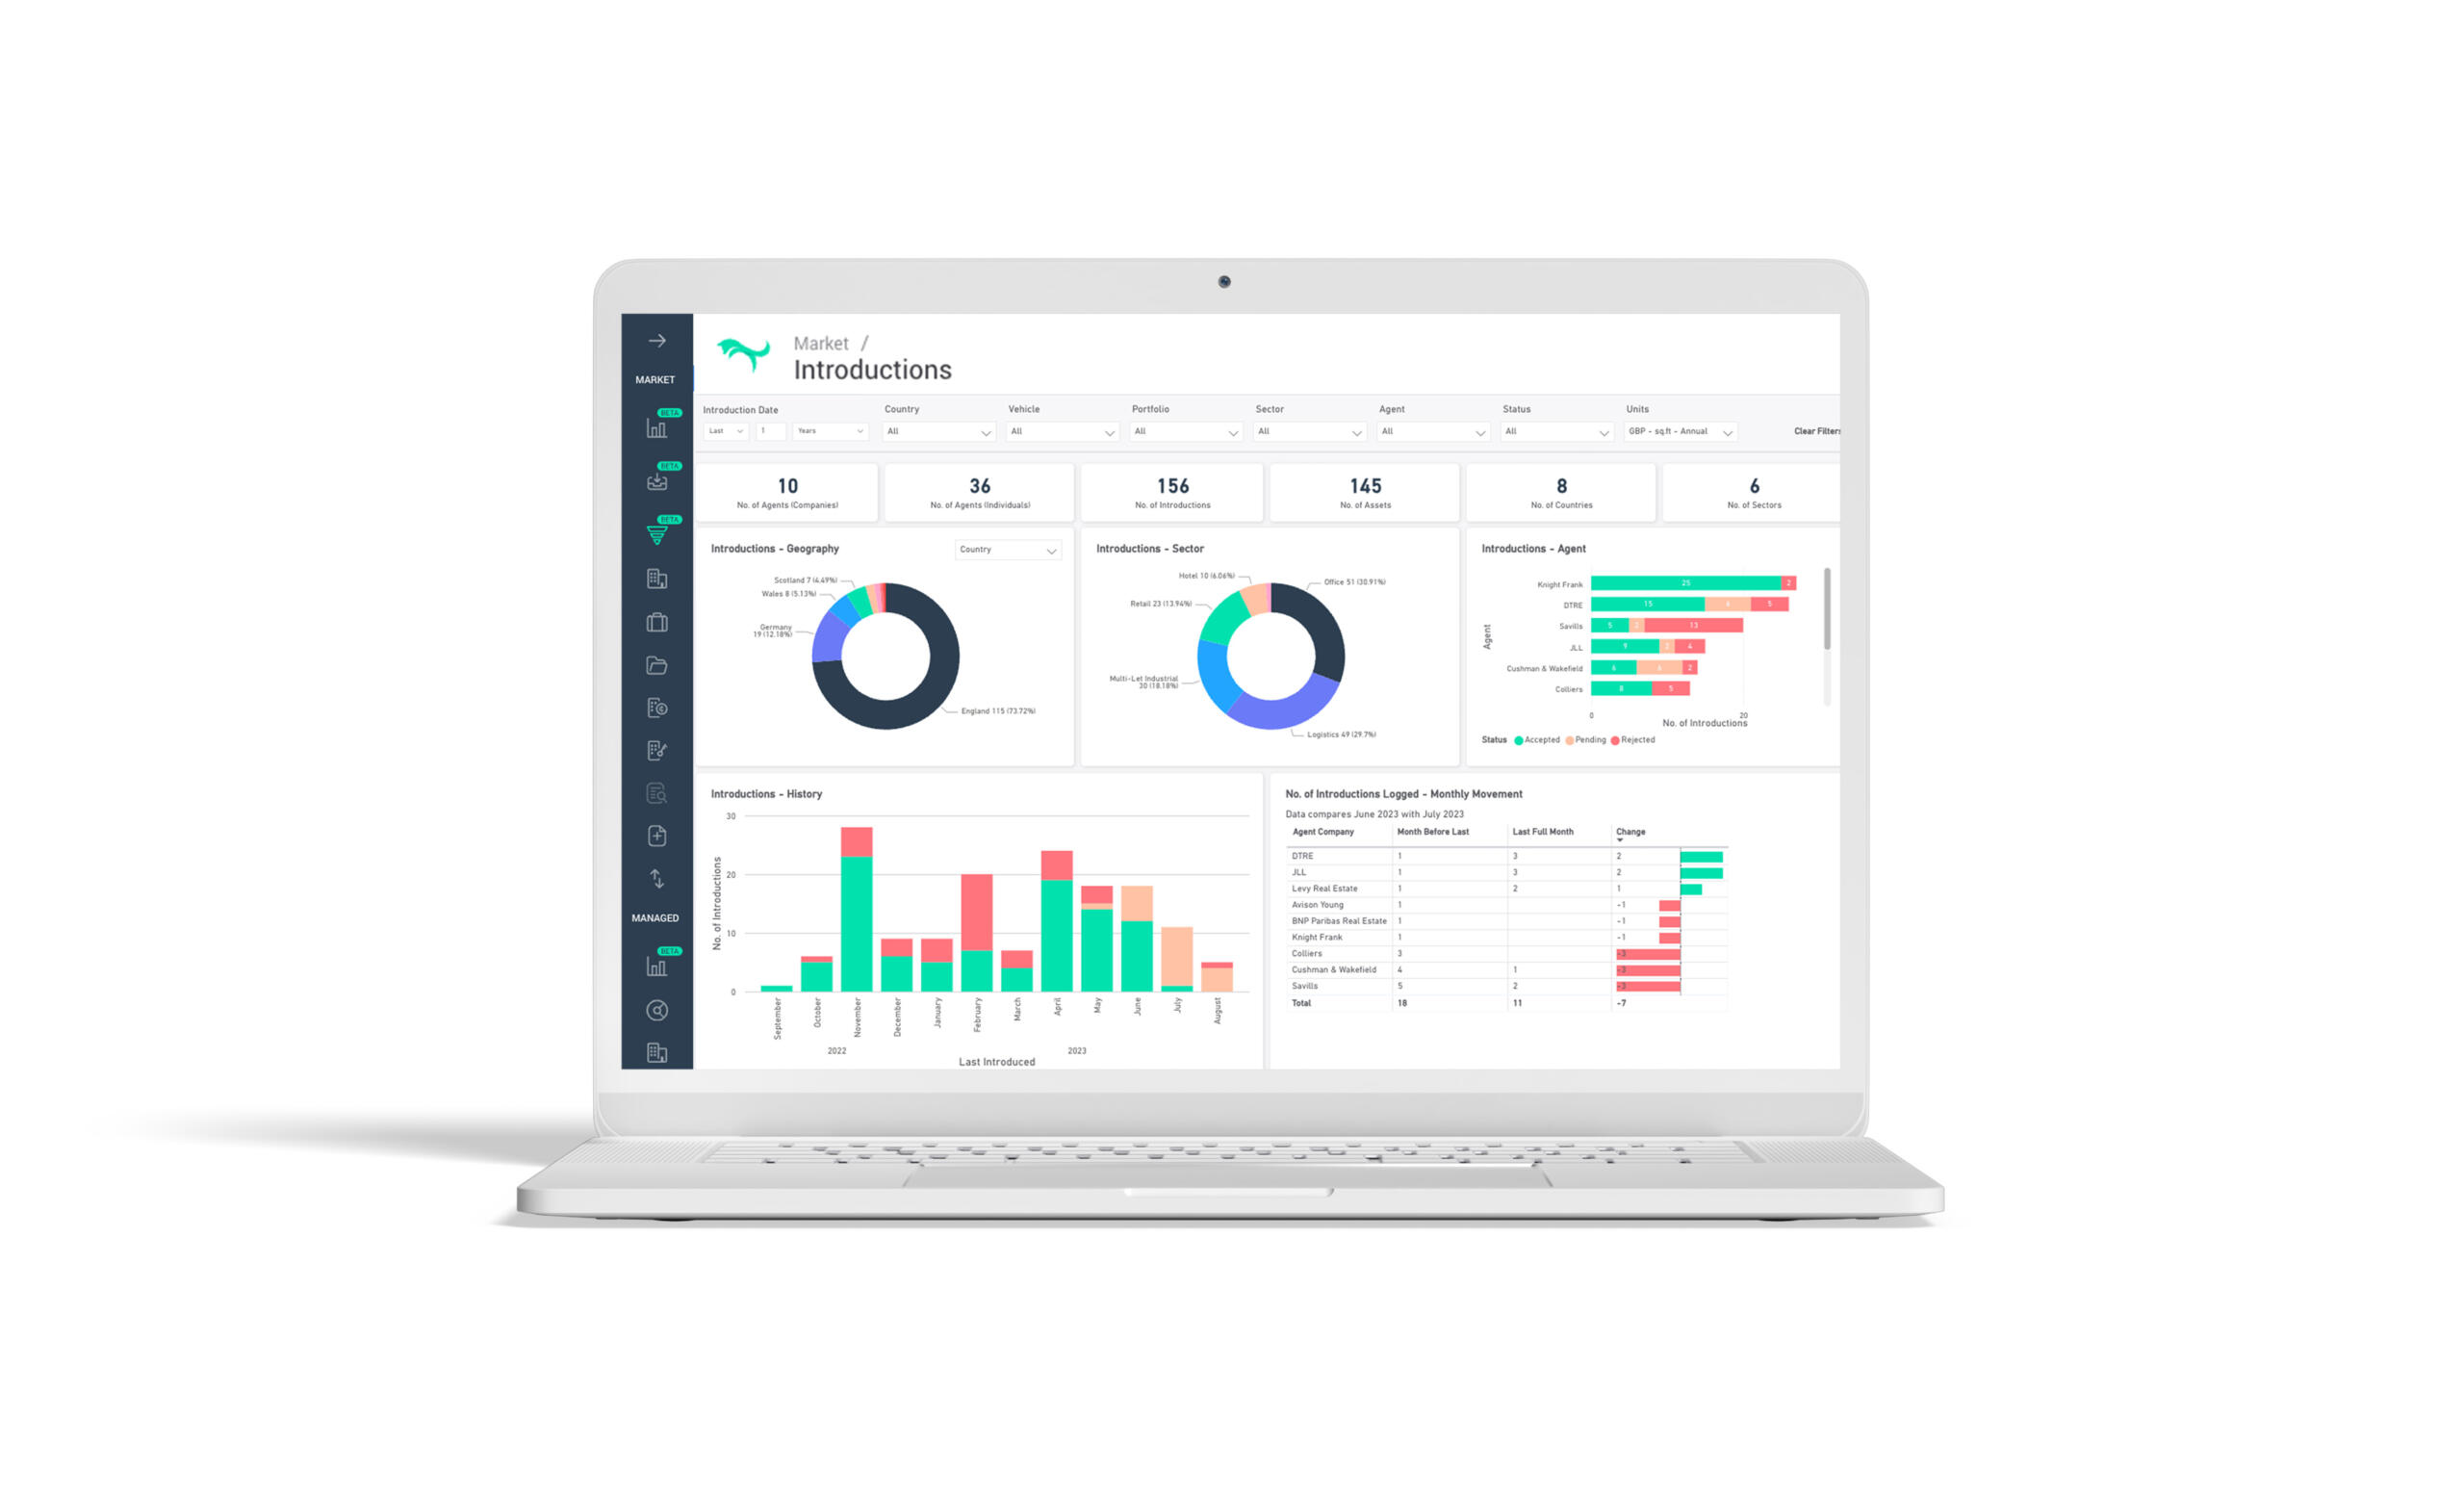
Our new advanced analytics dashboard does precisely that. The Introductions Dashboard lets you identify your highest (and lowest) performing agents by time period, sector, and geography.
Visualise trends for your intros over time with interactive graphs and charts to clearly identify your best-performing agents, sectors and geographies.
Focus your time on prioritising the agent relationships that matter to you, then watch the quality and quantity of investment opportunities improve over time.

Get in touch via the form below to book a demo
"*" indicates required fields